
What Is Per Capita Income? India's Latest Figures, State Gaps and the K-Shaped Economy Explained
How MoSPI calculates the figure, what it is in dollars and PPP, why an average hides the typical earner, state-by-state gaps from Bihar to Telangana, and the evidence for and against a K-shaped economy.
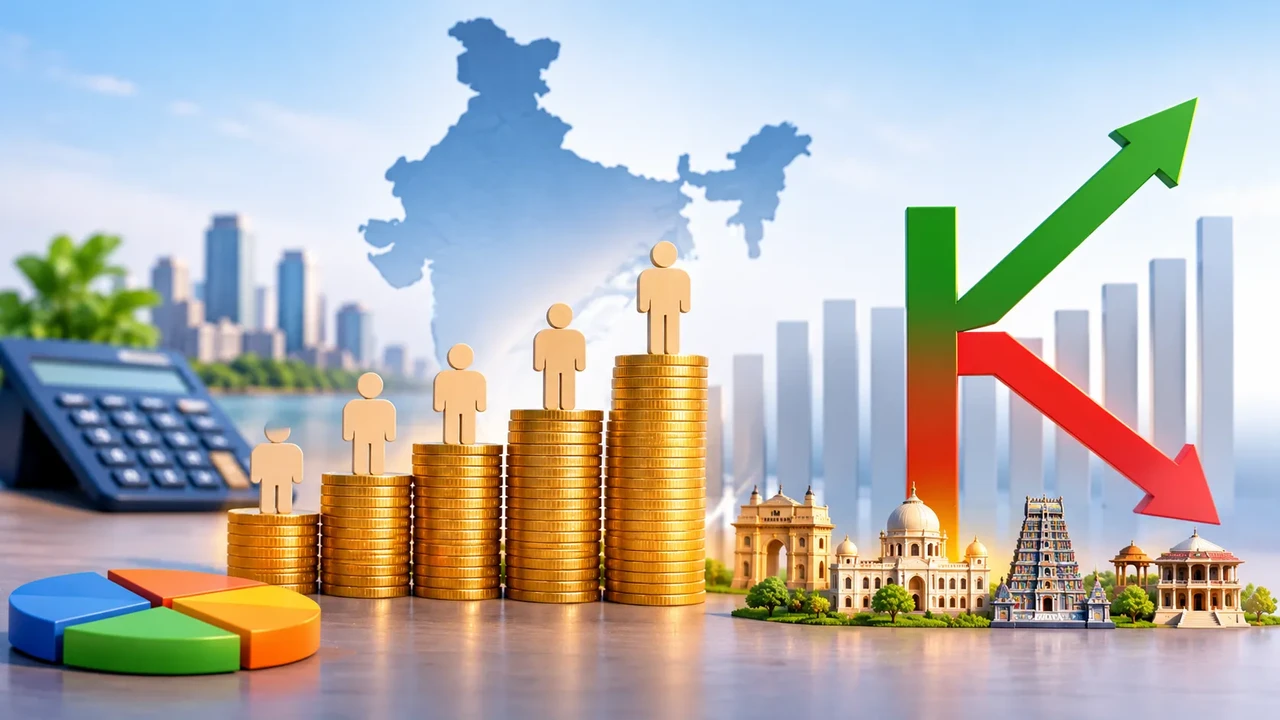
Quick answer: Per capita income is a country's total income divided by its population: the average income per person. In India, the Ministry of Statistics (MoSPI) measures it as per capita net national income (NNI). Its latest published per capita estimate for 2025-26, released on 5 June 2026, is ₹2,08,090 a year at current prices, or about ₹17,340 a month, up 7.9% from ₹1,92,774 in 2024-25.
That number is an average, not what a typical Indian earns. Because incomes at the top are very large, most people earn well below it. This is also why India can be among the world's biggest economies by total GDP and still be a lower-middle-income country per person, and why economists argue about whether India's growth is "K-shaped". Here is what each of these terms means, with the official numbers.
What per capita income means
Per capita income = national income ÷ population. "Per capita" is Latin for "per head".
MoSPI's version uses net national income: GDP, plus income Indians earn from abroad minus what foreigners earn here, minus depreciation (the wear and tear on machines, buildings and roads). You will see several related measures in the news, and they give different numbers:
Measure | What it is | India, 2025-26 |
Per capita NNI, current prices | MoSPI's "per capita income", at today's prices | ₹2,08,090 |
Per capita NNI, constant prices | The same, with inflation removed (2022-23 prices) | ₹1,93,480 (real growth 6.8%) |
Per capita GDP, current prices | GDP ÷ population; higher because depreciation isn't removed | ₹2,43,803 |
Source: MoSPI Provisional Estimates of GDP for 2025-26, press note of 5 June 2026.
Two points matter when you compare years. First, current prices include inflation, so use constant prices to see real growth. Second, MoSPI moved its national accounts to a new base year, 2022-23, on 27 February 2026. The new series lowered India's nominal GDP for 2025-26 by roughly ₹11–12 lakh crore compared with the old one, so per capita figures from the old 2011-12 series can't be compared directly with the new ones. MoSPI's National Accounts Statistics 2026, released on 31 August 2026, trimmed 2025-26 nominal GDP slightly (growth revised from 8.9% to 8.6%); its press release did not restate the per capita figures, so the June numbers may be revised a little when the detailed tables are updated.
Also read: What Would Happen If 1 US Dollar Were Equal to 1 Rupee? Explained
India's per capita income in dollars, and how it ranks
International comparisons convert rupees to dollars, and the method changes the answer a lot.
Market exchange rate (nominal): the IMF's October 2026 World Economic Outlook projects India's GDP per head at about $2,750 for 2026, which ranks India around 150th–155th of roughly 195 economies. On these projections, Bangladesh is slightly ahead of India.
Purchasing power parity (PPP): this adjusts for the fact that a haircut, a thali or a bus ride costs far less in India than in the US. On a PPP basis India's GDP per head is roughly $12,000–13,000, about 4.5 times the nominal figure, though India still ranks in the lower half of countries.
World Bank classification: the World Bank groups countries by GNI per capita (Atlas method, which smooths exchange rates over three years). In its July 2026 update India stayed lower-middle income, where it has been since the 2008-09 classification; the lower-middle band runs up to $4,635.
Why can India's total economy be one of the world's largest while its per capita income is low? Simple arithmetic: India's GDP is divided among about 1.4 billion people. A country with a fraction of the population and a smaller total economy can have a per capita income many times higher. Our explainer on what would happen if 1 dollar equalled 1 rupee shows why exchange rates alone don't decide how well off people are.
Why the average hides most people
An average can be pulled up by a few very high earners. Imagine ten people: nine earn ₹1 lakh a year and one earns ₹1 crore. Their average income is ₹10.9 lakh, but nine out of ten earn less than a tenth of that. The median (the person in the middle) earns ₹1 lakh.
India publishes averages but no official median income. The closest official data on what households actually live on, and earn, show the gap:
Household spending: MoSPI's Household Consumption Expenditure Survey (HCES) 2023-24 found average monthly spending per person of ₹4,122 in rural India and ₹6,996 in urban India.
Wages: MoSPI's Periodic Labour Force Survey (PLFS) annual report for January–December 2025 put average earnings of regular salaried workers at about ₹24,217 a month for men and ₹18,353 for women, and casual labourers' daily wages at about ₹455 for men and ₹315 for women. A large share of workers are self-employed or casual, not salaried.
Big differences between states
Per capita income also varies hugely by state. According to the Economic Survey 2025-26 statistical tables (old 2011-12 series, current prices), per capita net state domestic product in 2024-25 was:
State/UT | Per capita income, 2024-25 |
Delhi | ₹4,93,024 |
Telangana | ₹3,87,623 |
Karnataka | ₹3,80,906 |
Tamil Nadu | ₹3,61,619 |
Uttar Pradesh | ₹1,08,572 |
Bihar | ₹69,321 |
Telangana's figure is about 5.6 times Bihar's. Small states such as Sikkim and Goa have even higher per capita income (about ₹5.9 lakh in 2023-24).
Is India's income inequality rising or falling?
This is where the data are genuinely contested, because different measures point in different directions.
Measures showing high or rising inequality: the World Inequality Report 2026, from the World Inequality Lab, estimates that the top 10% of earners in India received about 58% of national income in 2025, and the bottom 50% about 15%. Its estimates show the top 10%'s share of income rising over the past two decades.
Measures showing falling inequality: consumption surveys show the opposite trend. The HCES consumption Gini fell from 0.266 to 0.237 in rural India and from 0.314 to 0.284 in urban India between 2022-23 and 2023-24, and the World Bank's consumption-based Gini for India fell from 28.8 in 2011-12 to 25.5 in 2022-23. The government has cited this as evidence that India is among the more equal countries.
Why both can be true: consumption is always more equal than income, because rich households save much of their income while poor households spend almost all of it. Fact-checkers such as Alt News pointed out that comparing India's consumption Gini with other countries' income Ginis is not like for like. Survey data also tend to miss the very richest households, which pulls measured inequality down. Neither number alone settles the question.
Also read: Why Can't We Print More Money? Inflation, Hyperinflation and the RBI Explained
What a K-shaped economy means
A K-shaped economy is one where, after a shock, different groups move in opposite directions, like the two arms of the letter K. The upper arm (higher earners, people who own shares and property, large formal firms) recovers and grows; the lower arm (informal workers, small businesses, lower-income households) stagnates or falls behind. The term became popular during the recovery from the 2020 COVID lockdowns.
Evidence often cited for a K-shape in India:
Housing: according to property consultancy Anarock, homes sold in India's top seven cities fell about 14% in 2025, while the total value of sales rose about 6%, because buyers shifted to costlier homes and the share of homes under ₹40 lakh shrank.
Cars: industry data reported by The Tribune and others showed sales of entry-level small cars shrinking from 2023 to 2025, while utility-vehicle sales kept growing.
Evidence against, or complicating the picture:
SBI Research argued in January 2024 that the K-shape claim was flawed, pointing to income-tax data that showed the inequality of taxable income falling between 2013-14 and 2021-22 and many low-bracket taxpayers moving up.
Mass demand has recovered in places: after GST on small cars and most two-wheelers was cut from 28% to 18% on 22 September 2025, industry body SIAM reported two-wheeler dispatches to dealers up about 20% in April–June 2026 from a year earlier. Passenger-vehicle dispatches rose about 26%, though SUVs led that growth.
A fair reading is that India's growth has been uneven, with formal-sector and urban higher earners doing better since 2020, but the extent and the direction of change depend heavily on which data you use. For the rupee's side of the story, see why the rupee is falling against the dollar.
Frequently asked questions
What is India's per capita income in 2025-26?
MoSPI's provisional estimate, released on 5 June 2026, is ₹2,08,090 a year at current prices (per capita net national income), about ₹17,340 a month. At constant 2022-23 prices it is ₹1,93,480.
Is per capita income the same as average salary?
No. It divides all national income, including company profits, rent and interest, by the whole population, including children and people who don't work. It is a measure of the economy's average, not anyone's pay.
Which state has the highest per capita income in India?
Among states, Sikkim and Goa have the highest per capita income (about ₹5.9 lakh in 2023-24); among large states, Karnataka and Telangana lead, and newer estimates for 2025-26 reportedly put Karnataka ahead. Bihar has the lowest.
Why is India called a lower-middle-income country?
Because its gross national income per person, measured by the World Bank's Atlas method in US dollars, falls in the World Bank's lower-middle-income band. India has been in this group since the World Bank's 2008-09 classification.
Filed under Finance


Comments